
Still in the Box: The Data Warehouse You Already Own

You're sitting on a gold mine, Trebek! Hidden insights that used to cost tens of thousands of dollars to uncover are sitting under your data Christmas tree. You just need to unwrap the tools holding them, and plug 'em in!
I figured this out when I became frustrated a few weeks ago with the data and analysis I could create for myself as a small business. I did a little digging, surely everyone can't be suffering like me, and I found out that what I had thought was going to be really hard and expensive for me to discover in my data was actually surprisingly cheap and easy to access. I even already had a data warehouse I was paying for, but not using. And, as it turns out, pretty much all of us have this available nearly for free, too!
I'm a Martech architect and executive advisor. I spend my working life in the gap between marketing teams, the developers who build their sites, and the leaders who have to decide where the next dollar goes. Recently I built an analytics system for my own business, connecting my publishing schedule, my website analytics and my search data in one place, with a dashboard on top that answers the specific questions I actually make decisions with. It costs almost nothing to run, and with a little expertise, I was able to cajole my AI agent into plowing through the grunt work I didn't want to do. Most marketing teams (aka YOU) already own every component I used. You already bought the gift of data insights; what's missing is an easy and cheap way to unwrap these insights.
A quick note: I don't run paid advertising, so my pathpractical.com traffic is a lot smaller than the commercial marketing programs I consult for. (And for the people I'm writing this for: you!). The figures below come from real behavior on my site, scaled up by 1,000 so you can see what a commercial program might look like.
The tools are already in the box
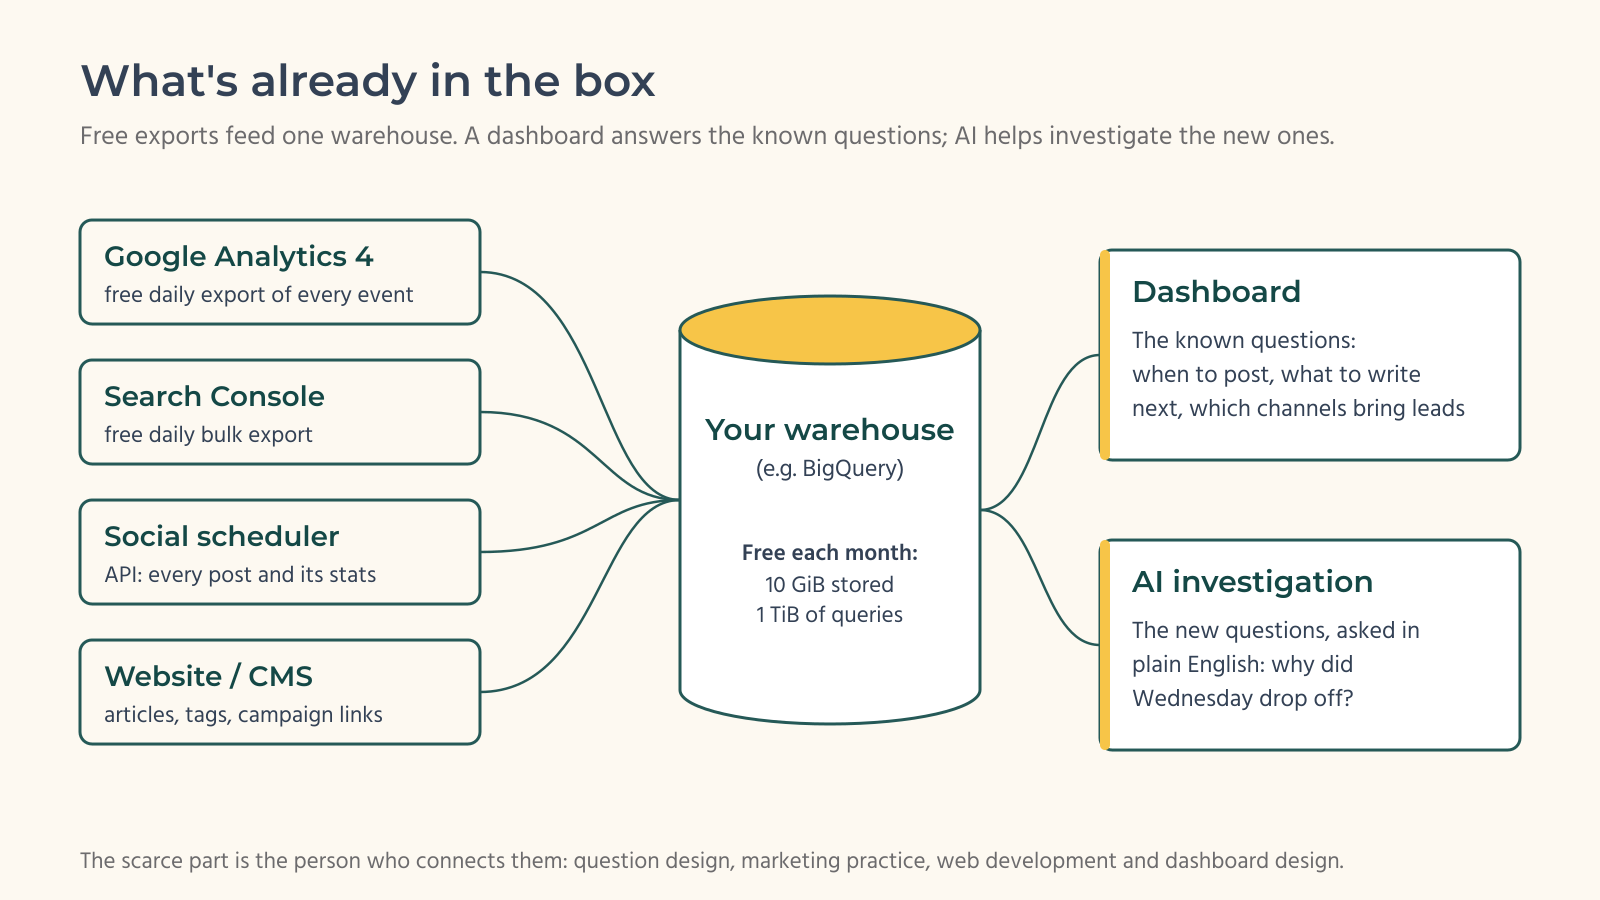
Most marketing leaders I talk to assume a data warehouse is an enterprise project: a six-figure platform, a data engineering team, and a year of meetings. A decade ago that was fair. Today the most valuable marketing data you have can be piped into Google's BigQuery warehouse at no charge, and the export options are sitting in settings screens your team has probably scrolled past. Google Analytics 4 will send every raw event your website records into BigQuery every day, for free, on standard (non-paid) properties (up to a million events a day, which covers most mid-size sites).¹ That matters more than it sounds, because GA4's own exploration reports keep that detailed event data for as little as two months by default, and fourteen months at most, while your exported copy stays for as long as you want it.² Since 2023, Search Console can do the same thing with your search data, sending a daily export of the queries and pages Google shows you for.³ And most social scheduling tools, including Buffer, which I use, have an API that will hand over every post you've published along with its impressions, reactions and comments. With just a little bit of work, you can get the kind of insights that used to be reserved for the Fortune 500.
Then there's the bill. Most people I know in analytics are scared to even experiment with warehousing because there isn't a flat cost ahead of time. They worry they are going to accidentally end up with a $10,000 a month invoice. BigQuery charges for two things, storing data and reading it with queries, and it gives every account a free allowance of each: 10 GB of storage and 1 TB of queries every month. Past those allowances, storage costs about two cents per gigabyte a month and queries cost $6.25 for each terabyte they read.⁴ Here's what that bill looks like as a program grows, starting from my own site's real, unscaled numbers. Each warehouse holds every website event, every search query, every social post and its stats, plus the tables behind the dashboard:
Program size | Data stored | Data read by queries each month | Monthly bill | Yearly bill |
|---|---|---|---|---|
A small business (my actual site) | 6 MB | 0.004 TB | $0 | $0 |
A typical commercial program | 6 GB | 4 TB | about $20 | about $240 |
Three times bigger | 18 GB | 12 TB | about $70 | about $850 |
Ten times bigger | 60 GB | 41 TB | about $250 | about $3,000 |
Treat these as ballpark figures, not a quote: the query bill depends as much on how heavily people use the dashboard as on how much traffic you have. The shape is clear, though. A small business pays nothing, a typical commercial program pays less than a team lunch, and even a program ten times that size pays about $250 a month, a long way from the $10,000 surprise people worry about. If better data costs your business less than $1,000 a year in infrastructure, cost isn't going to hold you back; the challenge is identifying the questions that move your business forward. For most small and mid-size businesses, that's where this lands.
“If better data costs your business less than $1,000 a year in infrastructure, cost isn't going to hold you back; the challenge is identifying the questions that move your business forward.”
Here's an uncomfortable truth. Cheap data hasn't made marketing teams noticeably more data-driven, even though marketing leaders keep naming it as their best bet. In Gartner's 2025 survey of 402 marketing leaders, 41% put using data, analytics and measurement to optimize campaigns among their top five productivity strategies, more than any other strategy on the list.⁵ Yet when Gartner asked marketing analytics users directly in 2022, analytics influenced only 53% of marketing decisions, meaning almost half of the calls were still made on instinct, habit or the loudest voice in the room.⁶ The respondents' most common complaints were that their data was inconsistent across sources and hard to get to, which is exactly the problem that happens when the exports never get turned on and every tool keeps its own private version of the truth.⁶ The folks I consult for desperately WANT this data, but it's expertise in using these tools, not the cost, that's holding most of them back.
Start with the questions, then build the dashboard
I've written before about the graveyard of dashboards nobody opens, and why fifty clear words usually beat a wall of charts.⁷ That's still true, and it shaped how I built this one. Before writing a single query, I wrote down the questions I make real decisions with, and each section of the dashboard is named after one of them, in plain words:
- Is the site turning visitors into booked calls?
- Which channels bring leads, not just visitors?
- Which posts turn readers into leads?
- When does my posting bring people in?
- What do people actually do on the way to booking?
- Where in my most-read posts could a call to action catch readers before they leave?
Each one is tied to something I'll actually do differently depending on the answer: rewrite a page, move effort from one channel to another, change when I post, or add a booking link halfway down an article people read but rarely finish. Where it helps, a section opens with a sentence or two that names the problem and the next step, so I don't have to read the chart to know what it's telling me.
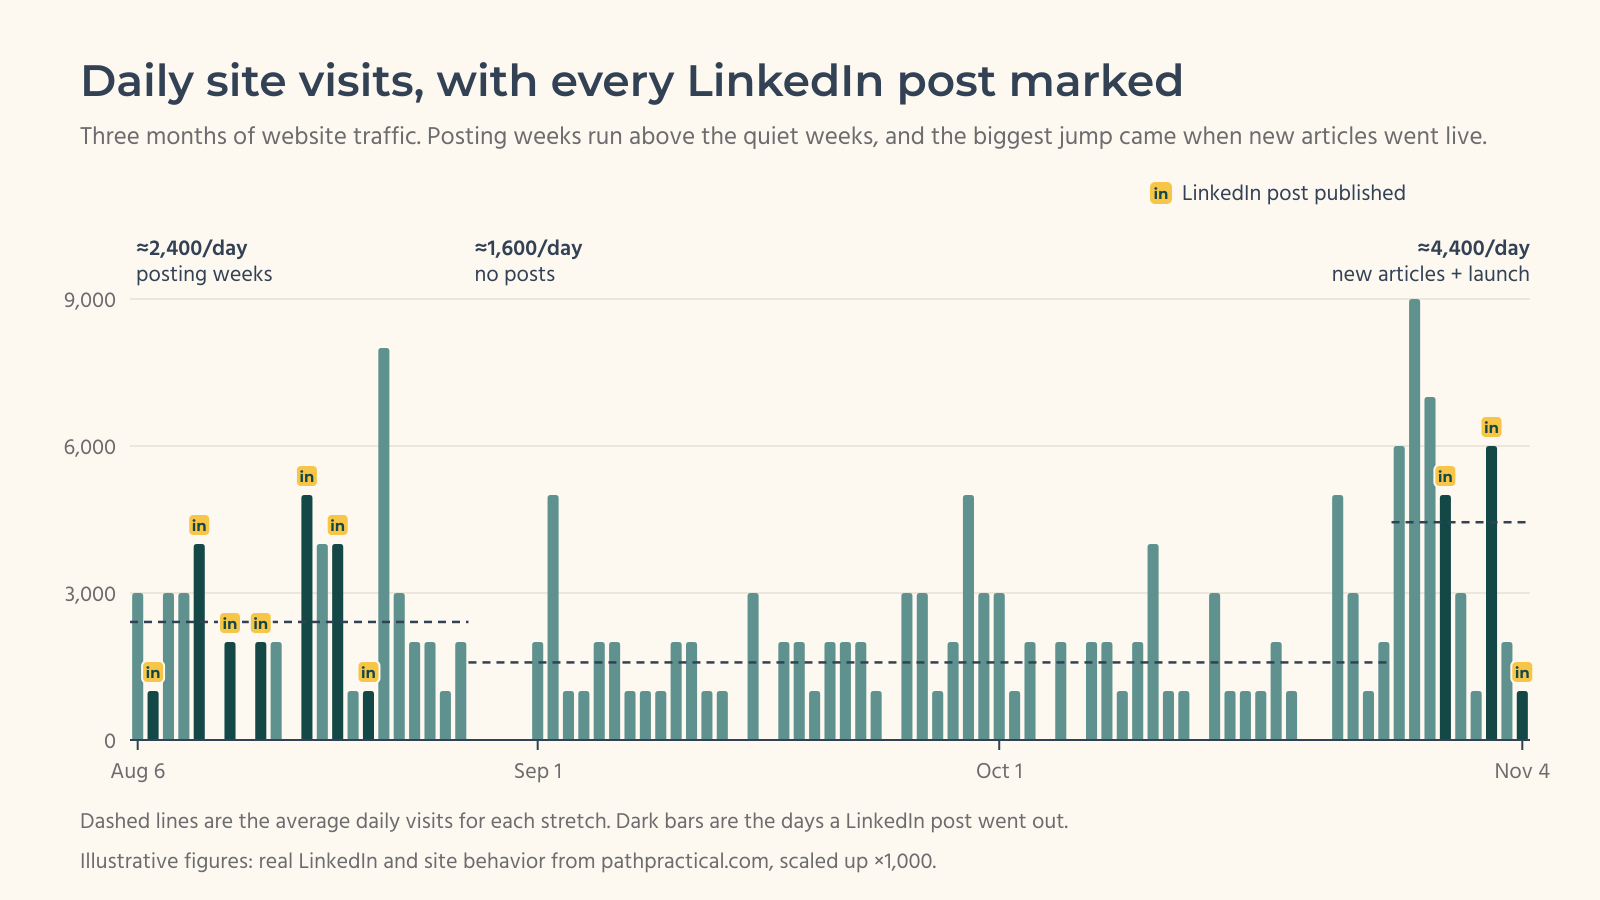
A favorite example is the chart I created for question four. It puts every LinkedIn post right on top of daily site traffic, so the effect of publishing is visible at a glance. Weeks with posts run well above the quiet stretch in between, and the biggest jump of the quarter came when a batch of new articles went live. A chart like this can't prove what caused each bump on its own, but it tells me exactly where to look, and it's the first place I check after any change to how or when I publish. Pretty much every business that relies on GA4 dashboards doesn't have this chart, or this kind of data easily available.
This approach is backed by research, too. A 2026 study in the Journal of Business Research found that analytics improves business results mainly through one channel, the quality of the decisions it informs, and that smaller firms gain the most from what the author calls "lean, integrated data-to-decision systems."⁸ That phrase describes the whole project. The warehouse is the integrated part and the question-led dashboard is the lean part. The decisions are the point.
A dashboard earns its place by changing what someone does next week. The first real change mine made came from the search data, which showed me the searches Google already displays my site for, where I don't have a page that answers the question. I now pick my next blog posts from that list first, because those topics start with a head start on traffic. Nobody had to be persuaded to look at a report. The report changed my editorial calendar.
Have the tools, but not the time to connect them?
25 minutes to map which free exports to turn on and which questions your dashboard should answer first.
What to do with a discovered insight
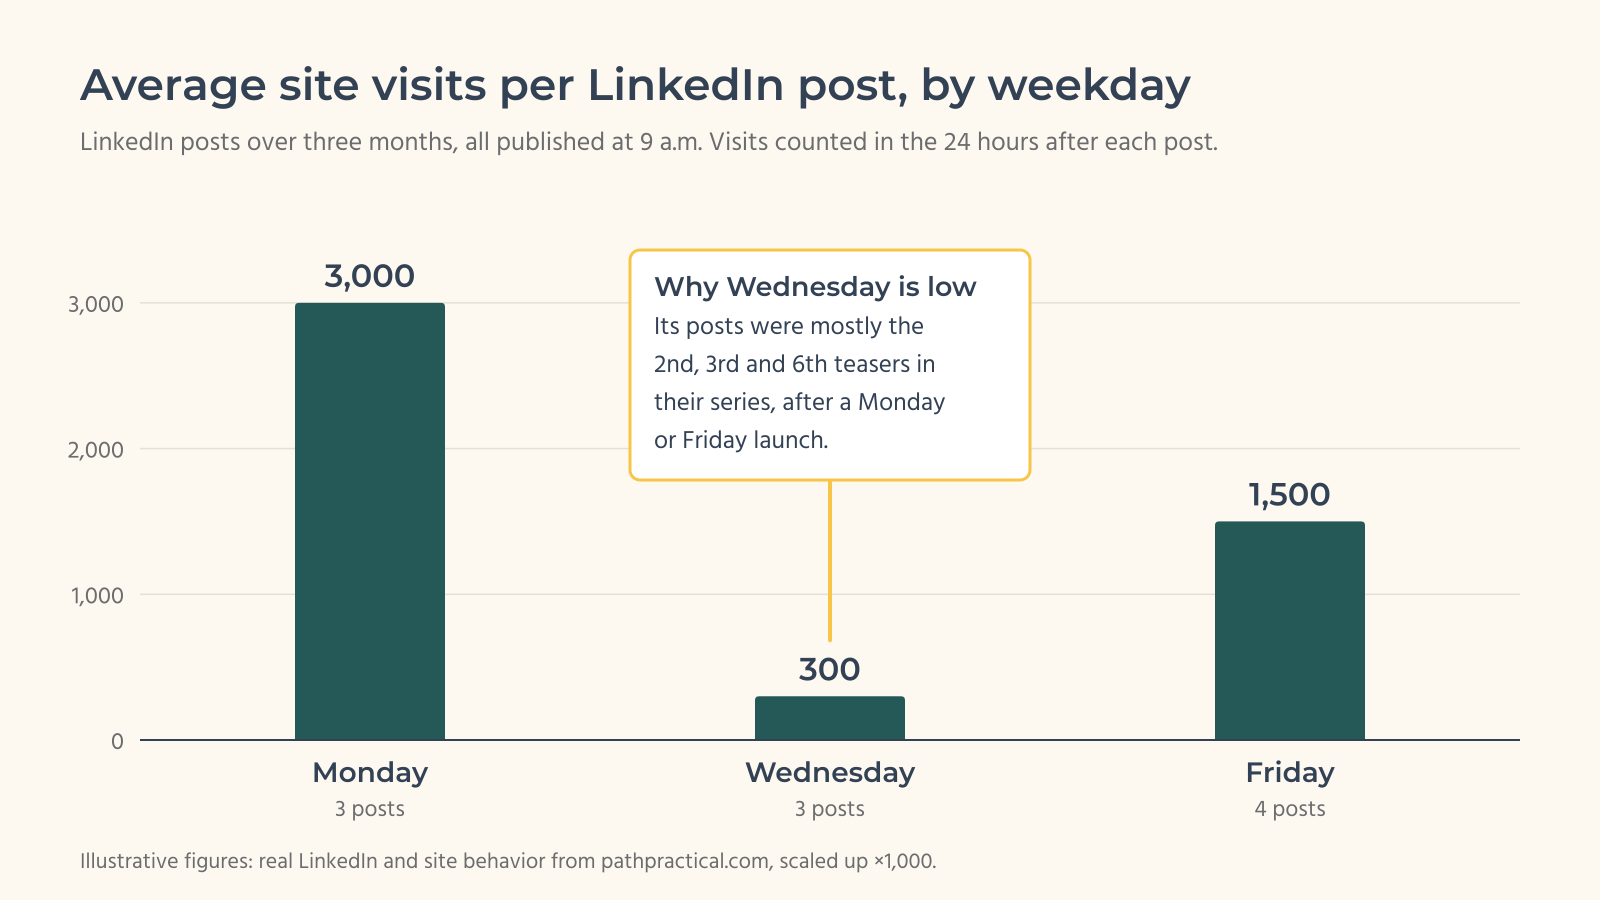
Here's an example from my own dashboard. Its "when does my posting bring people in?" section compares LinkedIn posts by the day and hour they went out. Over three months, Monday posts averaged about 3,000 visits each to the site, Friday posts about 1,500, and Wednesday posts about 300, a tenth of Monday's number.
The obvious question this raised for me was: Should I stop posting on Wednesdays? The answer lay in my content strategy. Each new article that I post gets a short series of teaser posts on a Monday, Wednesday, Friday rhythm. A series starts on Monday or Friday, which means the launch post (the one that gets the most attention) almost always lands on one of those days, and Wednesday almost always gets a later teaser, after the audience has already seen the topic at least once. Wednesday was standing in for "later post in a series." A chart can't tell you that. Someone who knows the publishing calendar can. This is why these dashboards are most useful for your domain experts, and less valuable for your executive team. Just a little something to keep in mind.
There was a second, quieter problem underneath. Every one of my ten LinkedIn posts in that period went out at the same time of day, 9 a.m. my time. That meant the data could compare weekdays, but it had nothing at all to say about hours. No amount of better charting could fix that, because the information didn't exist. This was another great behavior change suggested by the insight! I needed to run a test. Launch posts keep publishing at the same time, but follow-up teasers now rotate through three hours: the launch hour itself, as a control, plus lunchtime and late afternoon. Each new teaser goes to whichever hour has had the fewest so far, so every hour gets both early and late teasers in a series. I'll accept a few weaker teasers while the comparison builds up. At the end of this experiment, I'll have a better optimized teaser publishing schedule, based on my unique audience's preferences.
Being data-driven is a loop: the data changes what the team does, and the team changes what it does so the data can answer better questions. This is the part that's easy to skip when analytics is treated as a reporting project. The person reading the dashboard has to understand the marketing practice well enough to know when a pattern is real, and has enough authority to change the practice when the data can't answer the question as things stand. The goal of all this reporting is to test, validate, and improve.
“Being data-driven is a loop: the data changes what the team does, and the team changes what it does so the data can answer better questions.”
Dashboards track the known; AI queries against the warehouse help you investigate the new
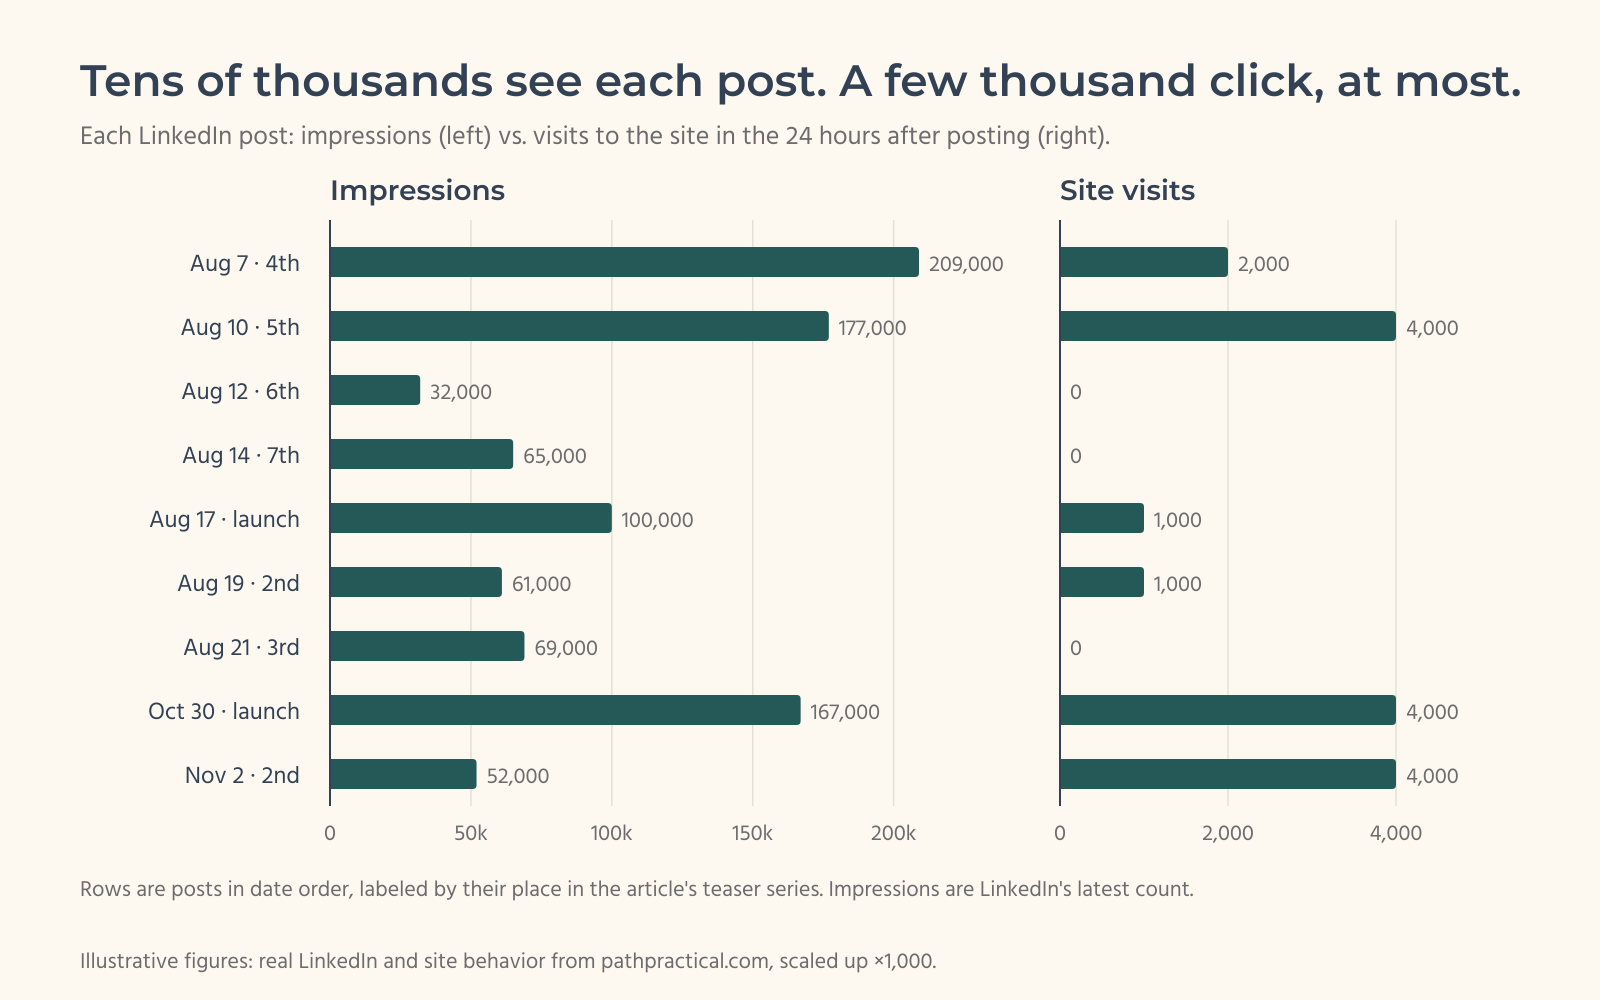
A dashboard is good at the questions you ask every week. It's weak at the question you didn't know you had until Tuesday afternoon, which is where my earlier post on dashboards ended up too.⁷ The Wednesday puzzle was exactly that kind of question. The dashboard raised it. Answering it took a handful of quick, one-off questions against the warehouse: which post in each series went out on which day, how many visits each one drew in its first 24 hours, and how impressions compared with clicks.
I asked those questions in plain English, and an AI model connected to the warehouse wrote and ran the queries. That's the second big change AI brings to small and mid-size analytics, alongside the cheaper build. Investigation used to mean filing a request with an analyst and waiting days. Now the person who has the question can usually get a first answer in minutes, as long as the data lives in one place the AI can query. That last condition is the reason the warehouse matters. An AI can't join your social posts to your website visits if they live in two separate tools with two separate logins.
The investigation also turned up a better signal. A typical LinkedIn post of mine (scaled) earns somewhere between 30,000 and 200,000 impressions, and between zero and 4,000 visits to the site in the day after it goes out. Impressions and engagement pile up much faster than clicks to the site, so they reveal timing differences far sooner. That became a new, permanent part of the system: the warehouse now records every post's impressions, reactions and comments, including a history of how they change, so posting times can be judged on engagement as well as visits.
Putting the two side by side turned up something I wouldn't have guessed. Follow-up teasers still reach a good share of a launch post's audience, but they lose more ground at the click. People are seeing them and not following through, which points to the invitation more than the timing. So alongside the hour test, the next experiment is a stronger link and call to action in follow-up teasers.
Use dashboards for the questions you already know matter, and use AI investigation for the ones you haven't thought of yet. When an investigation keeps getting repeated, it has earned a spot on the dashboard.
What AI changes, and what it doesn't
Most of the plumbing in this project was written by an AI coding agent (Claude Code) working under my direction: the sync that pulls every post and its stats out of the social scheduler, the warehouse tables, the scheduling logic for the test hours, and the checks that each piece worked. The whole system, dashboard included, took about 8 to 12 hours of my time, spread over a few working sessions. A contractor a few years back would have quoted that in hundreds of hours. That's the cost collapse everyone talks about, and it's real.
Building this efficiently and usefully only worked because my strategy came first, though. The agent was very good at building what I described, and it needed someone to decide what that should be. Two moments from the build show the difference. When the publishing history first needed to reach the dashboard, the agent's approach was to publish it as a data file the website could read, which worked fine. I saw that the publishing history belonged in the warehouse itself, right next to the website and search data, so that "what we published" and "what happened afterwards" could be joined in one query instead of being stitched together in code. That one decision is what made the plain-English investigations above possible.
The second was security. The agent set up a separate service account (a non-human login for one job) for the sync, able to write to one part of the warehouse and nothing else, and its own permissions check stopped it from granting access rights without me. While reviewing that setup, I found an older key in the system that had much broader access than its job needed: the dashboard's login could write to every table in the warehouse, when all it ever does is read. I flagged it, and it was fixed the same afternoon. The dashboard can now read everything but write only to its own tables. An AI agent will build what you ask for quickly and competently. Someone still has to judge whether you asked for the right thing, and whether it's safe.
AI makes building this cheaper once your strategy, key business questions, and tactical focus are right; before that, it just builds the wrong thing faster, and with issues you aren't likely to understand and that will be unpleasant to discover.
The missing puzzle piece
If the warehouse is free and the build is cheap, the scarce ingredient has to be somewhere else, and the surveys keep pointing to the same place from different directions. In Wavestone's long-running survey of data leaders at large companies, 78% said people, process, culture and organization were barriers to becoming data-driven.⁹ Research on small and mid-size firms finds the same thing at a smaller scale. A lack of understanding is one of the biggest things standing between these firms and any value from their data,¹⁰ and once they've adopted the tools, organizational readiness is what decides whether the investment pays off.¹¹
In practice, "readiness" for a marketing team usually means one person who can work across four areas that rarely sit in the same department:
- Question and report design: turning "how's marketing doing?" into specific questions tied to specific decisions, and designing each answer so it ends in a next step.
- Marketing and social practice: knowing how the team actually publishes, promotes and follows up, well enough to spot when a pattern in the data is really a pattern in the calendar.
- Web development and tracking: campaign tags on every link, events that mean what they say, and a website that records the moments that matter.
- Data architecture and dashboard design: where the data should live, who can touch it, how the pieces join together, and how to show the answer so a busy leader reads it in ten seconds.
Each specialist on their own produces a piece of this. The value shows up in the connections between them, and that's the work I do with clients. Sometimes I build it alongside their team, and sometimes I coach their people to build and run it themselves.
Where are you?
You probably already have the tools: an analytics account that can export for free, a Search Console that can do the same, a social scheduler with an API, and a warehouse whose free allowance would cover most of your program. You don't need to buy anything to start. You need to know which decisions the data should change, and you need someone who understands your marketing, your website and your data well enough to connect them and to notice when the numbers are pointing at the calendar rather than at your audience.
Your tools are still in the box.
Here's a small exercise before you do anything else. Write down three decisions your team makes on instinct every month that you'd change if you had a clear, trustworthy answer. When to post, what to write next, which channel deserves the next dollar, where people drop out before they contact you. Make them specific enough that you'd know what to do with the answer. Then bring your three questions to a conversation with me, and we'll work out what it would take to answer them: which exports to turn on, what to connect, and what your dashboard should say. Are you ready to be the leader whose team runs on answers instead of instinct?
Quick Reference: Building a Decision-First Marketing Warehouse
Step | What it means | Why it matters |
|---|---|---|
Turn on the free exports | GA4 → BigQuery, Search Console bulk export, your scheduler's API | Your richest data stops expiring and starts living in one place, usually at no cost |
Write the decisions first | Three to six plain-language questions, each tied to an action | A dashboard that changes nothing gets ignored, however good it looks |
Name each section after its question | Lead with a sentence that names the problem and the next step | The reader knows what to do without decoding a chart |
Check patterns against the practice | Ask the person who knows the calendar before acting on a trend | Weekday "losers" are often just later posts in a series |
Change the practice to get better data | Rotate test times, vary formats on purpose | Some questions can't be answered until you start doing things differently |
Use AI for the questions you haven't asked yet | Plain-English questions against the warehouse | Investigation takes minutes instead of days |
Set the strategy before the AI builds | Decide the questions, focus and architecture first | AI builds fast, including the wrong thing |
Give every connection the least access it needs | One login per job, one dataset each | Cheap, fast builds still need a security review |
If you'd like help turning your three questions into a system your team actually uses, book a consultation and bring them with you. I'll help you work out what's already in your box and what's worth building.
References
- GA4 can export raw event data to BigQuery daily or continuously, including on standard properties (daily export capped at 1 million events a day): Google Analytics Help, "[GA4] Set up BigQuery Export"
- Standard GA4 properties keep event-level data for explorations for 2 or 14 months, and exporting to BigQuery is the usual way to keep it longer: InfoTrust, "Google Analytics 4 Data Retention Settings 101"
- Search Console added a free, ongoing daily bulk export to BigQuery in February 2023: Google Search Central Blog, "Bulk data export: a new and powerful way to access your Search Console data," 2023
- BigQuery's free tier covers 10 GiB of storage and 1 TiB of queries a month; after that, active storage costs about $0.02 per GiB a month and on-demand queries cost $6.25 per TiB: Google Cloud, "BigQuery pricing"
- 41% of CMOs and marketing leaders named data, analytics and measurement to optimize campaigns as a top-five productivity strategy, the highest of any strategy (survey of 402 marketing leaders, Feb–Mar 2025): Gartner, "Gartner 2025 CMO Spend Survey Reveals Marketing Budgets Have Flatlined at 7.7% of Overall Company Revenue," 2025
- Analytics influenced 53% of marketing decisions; top barriers were inconsistent and hard-to-access data, and a third of respondents said decision makers cherry-pick data: Gartner, "Gartner Survey Reveals Marketing Analytics Are Only Influencing 53% of Decisions," 2022
- Why fixed dashboards go unused, and how conversational analytics answers the questions nobody anticipated: PathPractical, "Death by Dashboards: Why 50 Words Beat Your BI Charts"
- Decision quality is the main mechanism linking analytics capability to firm performance, and smaller firms benefit most from lean, integrated data-to-decision systems: Mamakou, "Linking business analytics to firm performance: A mixed-method analysis of capabilities, decision quality, and firm size," Journal of Business Research, 2026
- 78% of data leaders cited human factors (culture, people, process, organization) as the barrier to becoming data-driven: Wavestone, "2024 Data and AI Leadership Executive Survey"
- In small and mid-size firms, lack of understanding and data security concerns were the strongest inhibitors of value from data analytics: Perdana et al., "Data analytics in small and mid-size enterprises: Enablers and inhibitors for business value and firm performance," International Journal of Accounting Information Systems, 2022
- After adoption, organizational readiness becomes "the binding constraint" on SMEs getting value from analytics: Ho et al., "Big data analytics adoption and firm performance: evidence from Singapore SMEs," Journal of Enterprise Information Management, 2026
The figures for traffic, impressions and data volume in this piece are based on real reader behavior on pathpractical.com, scaled up by a factor of 1,000 to match a typical commercial marketing program. Query costs are calculated from the scaled data volume at Google's published rates. Prices, free-tier limits and counts of posts and queries are unscaled.